Machine First Operations
Stitching together multifunctionality AI powered tools like
Dynatrace, ServiceNow, Ignio & Power-BI to
create an end to end Self-heal mechanism.
Starting from sensing of the issue to notifying,
automated resolution and trend analysis
Motivation (Why)
Often in any IT environment, a large amount of load falls on the shoulders of the operations team. To keep the business application up, with all the functionalities intact and running with the best performance, to keep the user satisfied. While ensuring all the necessary components are smooth, people in the Operations team get overburdened and lose a grip of their work-life balance.
To help the Operations team, I designed and implemented an AiOps solution by stitching multiple tools after researching their functionalities, stitching them together, and integrating them into an end-to-end workflow to Self-Heal issues 24x7.
Techtics (What & How)
There are many different tools and techniques that I had encountered, learned about, and utilized in the IT environment. While serving as Application Performance Management (APM) and Automation/AI Architect & Lead I designed an end-to-end solution for the overworked Operations team.
To explain this solution, let's start with what kinds of different layers are needed to be understood thoroughly and stitched together to work in harmony, if even a single timing or integration is missed, the whole Self-Heal mechanism will collapse.
Layer 1 - Server, Middleware and Hosted Applications
 This layer constitutes of the Servers that are hosting the application and the middlewares that are used to run the applications smoothly.
A server can have different OS flavors such as Linux, Windows, Solaris, AIX, HP-UX, etc. Each of which has different properties, architecture, and integration points.
Next is the middleware that is used to host the application or integrate the message passing of the interconnected applications, such as JVM, Weblogics, Wildfly, JBoss, WAS, MQ, etc. Again, these are very different from each other and a thorough knowledge of what properties they have is required to correctly fetch the data from them.
Finally, we have the Applications we would mostly be focusing on JAVA and Spring-based applications hosted on Linux-based servers. Most application will have a frontend and a backend, both of which provides valuable information on how the business value & user satisfaction is impacted during any issue.
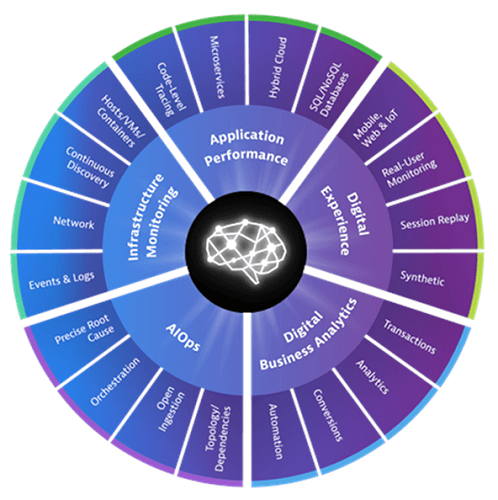
Layer 2 - Sensing and Monitoring
 Layer two is one of the most important layers, as the accuracy of the issue tracing depends on this layer. There are many monitoring tools in the market with multifaceted capabilities, so picking the correct tool for the requirement is of absolute importance.
These tools must be capable of tracing events, logs, and various metrics from the servers, processes, application services, user requests, message queues, network load balancers, firewalls, etc. Here, we will be selecting 'Dynatrace'; one the market-leading APM tools.
Layer 3 - Ticketing, Reporting and Visualization
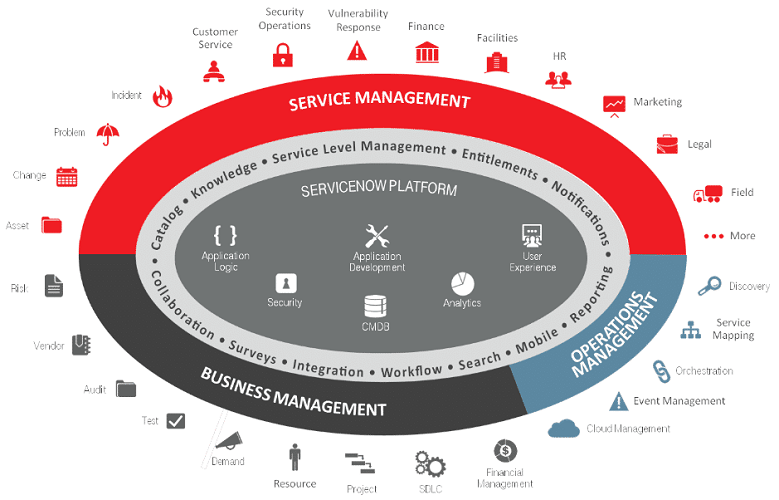
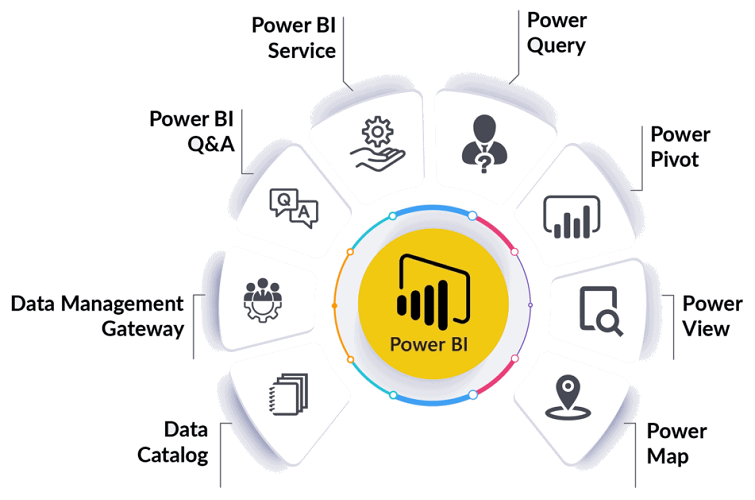
 The 3rd layer is used for Service Management, various companies provide this solution, we would utilize ServiceNow for Service Requests, User Requests, Incident creation, Change, Problem, and Knowledge Management, etc. Power BI will be our go-to tool for Reporting and Visualization, we could also choose Tablue as an alternate, which gives us similar capabilities as that of Power-BI.
This layer interfaces the Operations Team with the system and the users who want to raise an issue in form of a ticket. Additionally, the monitoring layer senses anomalies and reports in form of incidents in this layer that is then handled by the Operations team. We will use this layer to also connect with our data-driven automated workflow.
Layer 4 - Orchestation and Automation
 The last layer is where the actions, their sequence, and timings are defined; here is where the magic happens.
We need a good Orchestration and Automation engine to ensure that the Workflow is stable and is timely executed. We are going to use various scripts (Python, PowerShell, Bash, etc.) and schedulers such as cronjobs, batch jobs (BMC Control M), Windows Task Schedulers, etc.
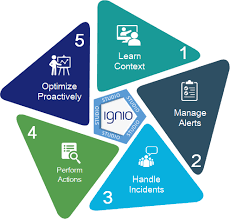
We will use TCS Digitate - Ignio AiOps and Work Load Management as the automation engine, for designing the workflows and most importantly to pass the contextual data and leverage AI.
Reflection & Application (now & next)
Above is an example workflow of one implementation.
We sense and monitor application level anomaly for a Java-based application using Dynatrace. When a specific JVM (java virtual machine) related anomaly say Memory Garbage Collection High along with User request error is seen, a ticket in ServiceNow is generated in Ignio's queue. This ticket is picked by Ignio AiOps and then Action and Validation Workflow respective to this ticket is triggered. Https response codes are validated and based on which JBoss is restarted then another validation is made to check if the issue is now resolved. The Ticket is automatically resolved once the issue is fixed by the automated Self-Heal action.
In case the issue is not fixed even after the action is taken, the ticket is passed to the responsible operations team's queue to resolve manually. Work notes are automatically updated by Ignio in the ServiceNow ticket.
We use data-driven approach and actions are driven based on which level of issue data is sensed. Ignio AI also predicts future anomalies that can come up based on the pattern seen in the past issues. Dynatrace AI automatically reduces false alerts based on past data references. Rule-based and Component Relationship Map based context is used to guide the tickets to the correct responsible operations team by ServiceNow ITOM (Information Technology Operations Manager).
Contextual Knowledge from the Operations team is essential and should be dynamically stored and updated. Workflow is designed keeping in mind various use-cases and issues that can come up because of this automation. Rigorous testing is performed to ensure the automated self-heal action doesn't have adverse consequences.
Power-BI is used to get summary dashboards for the Operations team and Business Stakeholders.
Tools & Technology


Creators
Suryakant Sahoo